Microclimate determines how coffee cherries ripen and which flavor compounds accumulate in the bean. Two plots on the same mountain, separated by a few hundred meters of slope, can produce cups that taste like entirely different origins. That gap is not random — it is the direct result of localized temperature, humidity, and light conditions shaping every biochemical step from flowering to harvest.
- NOAA climate scientists confirm that even modest warming accelerates fruit development in ways that flatten bean quality and intensify pest pressure, pushing suitable growing conditions upslope.
- Some studies estimate a roughly 14% yield reduction per 1°C rise in growing-season temperatures, associating temperature increases with declines in both yield and quality.
- Specialty buyers already use microclimate descriptors — valley versus ridge, shade canopy type — as predictive signals for cup consistency, not just marketing language.
The sections below cover the causal pathways: which factors matter most, how they alter plant metabolism, what they mean for pest and disease risk, and how growers and roasters can use that knowledge on the farm and at the cupping table.
Table of Contents
- Why microclimate affects coffee at the farm level
- How each microclimate factor changes plant growth and cherry ripening
- From microclimate to cup: how localized conditions shape flavor
- How microclimate conditions drive pest and disease pressure
- Practical ways growers can shape microclimate on the farm
- What recent research says about warming and shifting microclimates
- How buyers and roasters should use microclimate information
- Key Takeaways
- The part of microclimate most buyers still overlook
- Taste the difference microclimate makes
- Useful sources for further reading
Why microclimate affects coffee at the farm level
A microclimate is the localized set of conditions — temperature, humidity, wind, rainfall, and sunlight — that exist within a small area and differ meaningfully from the broader regional climate. At farm scale, that can mean a south-facing slope versus a shaded valley hollow, a ridge exposed to afternoon wind versus a sheltered bench, or the understory beneath a dense canopy versus an open full-sun block.
The scale matters. Two plots a kilometer apart can sit in entirely different thermal regimes. A valley hollow retains cold air at night, slowing ripening. A ridge exposed to afternoon sun may push daytime temperatures several degrees higher than the regional average, compressing the fruit development window. The topography and vegetation structure around each plot create the actual climate the plant experiences, not the regional average on a weather map.
Key farm-scale microclimate drivers include:
- Slope aspect: South-facing slopes in the Northern Hemisphere receive more direct radiation; north-facing aspects stay cooler and more humid.
- Elevation band: Higher elevation generally means cooler mean temperatures and wider day-to-night swings.
- Canopy cover: Shade trees buffer daytime highs and raise nighttime lows, creating a more stable thermal environment.
- Proximity to water: Rivers and lakes moderate temperature extremes and raise local humidity.
- Topographic position: Ridges drain cold air; hollows collect it, creating frost pockets or humidity traps.
How each microclimate factor changes plant growth and cherry ripening
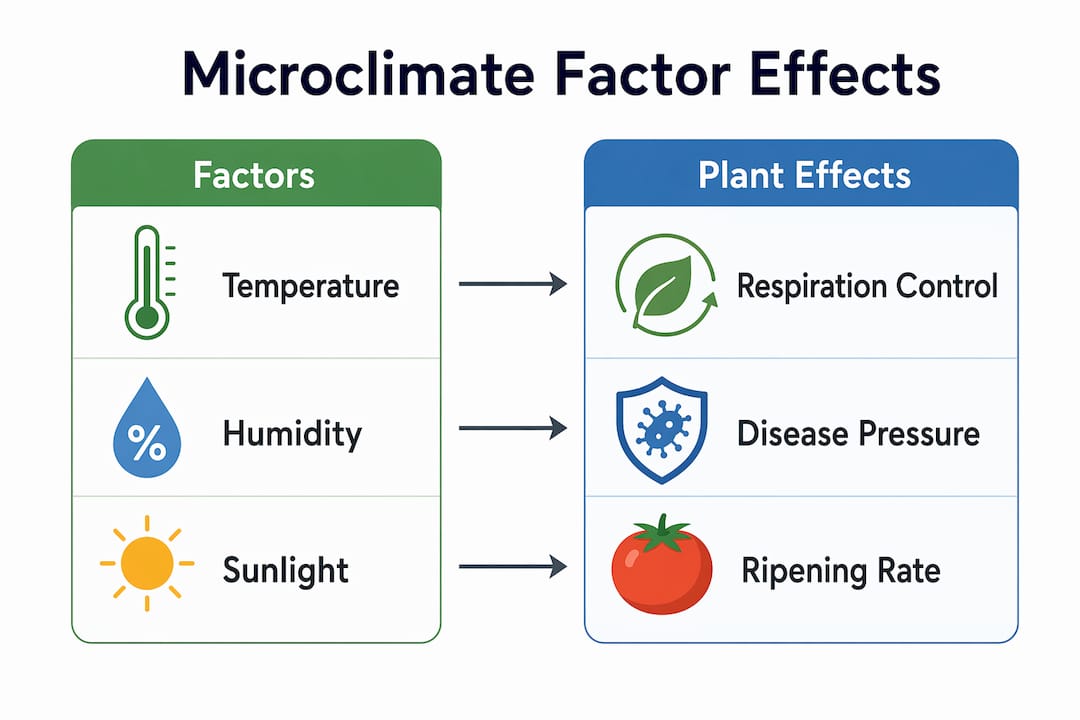
The table below summarizes the most directly measured effects. Each factor operates through a specific plant-level mechanism, and each produces a visible on-farm sign growers can track.
| Factor | Plant-level effect | On-farm sign to monitor |
|---|---|---|
| Mean temperature | Controls respiration rate, sugar accumulation speed, and ripening duration | Shortened picking window; uneven cherry color across a block |
| Diurnal temperature range | Wide swings slow metabolism at night, allowing more sugar and acid to accumulate | Brighter cherry color; longer time from green to red |
| Shade / canopy cover | Reduces daytime maxima by 4–5°C and raises nighttime minima by 0.5–2°C vs. full sun | Leaf wetness duration; canopy density changes |
| Humidity and rainfall timing | Drives flowering cues, fruit set, and seed expansion; deficit during ripening stresses the plant | Leaf curl, early cherry drop, reduced bean size |
| Soil moisture | Determines water uptake during high-demand phases (flowering, grain ripening) | Wilting at midday; reduced new-leaf flush |
| Wind exposure | Accelerates transpiration, increases water stress, and can damage flowers | Leaf edge burn; asymmetric canopy growth |
| Topography / aspect | Determines radiation load and cold-air drainage, setting the thermal baseline | Frost damage in hollows; sunscald on exposed slopes |
Shaded coffee systems commonly report minimum night temperatures 0.5–2°C higher than full sun and maximum daytime temperatures 4–5°C lower. That buffering is not cosmetic. Slower, cooler ripening extends the window for sucrose accumulation and organic acid synthesis — the two biochemical pathways most directly linked to cup quality.
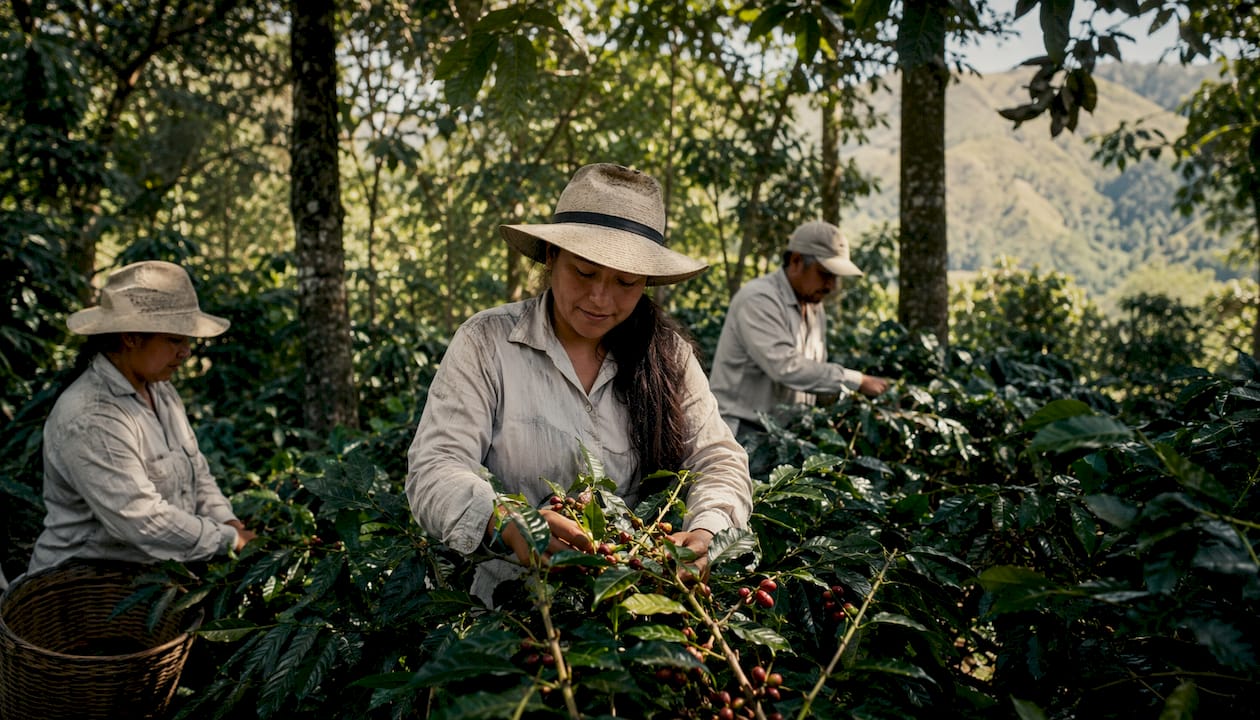
A PLOS One study tracking Coffea arabica in Veracruz, Mexico found that soil water storage and minimum temperature were the variables that best explained yield variability across three productive periods, confirming that microclimate conditions at the root zone and overnight low are more decisive than any single daytime reading.
From microclimate to cup: how localized conditions shape flavor
Microclimate alters the metabolic timing of the developing coffee seed, and that timing determines which flavor precursors accumulate and in what proportions. Three biochemical pathways connect directly to sensory outcomes.

Sucrose accumulation happens primarily during the final weeks of cherry ripening. Cooler nights slow cellular respiration, meaning the plant burns less of the sugar it produces during the day. The result is a sweeter, more complex cup. Warm nights accelerate respiration, and the sugar balance shifts toward simpler profiles with less perceived sweetness.
Organic acid dynamics follow a similar logic. Citric acid builds during slow, cool ripening; malic acid degrades faster in heat. A microclimate with a wide diurnal range tends to preserve the citric-acid fraction, producing the bright, clean acidity that specialty buyers associate with high-grown lots. Compressed ripening in a warm pocket flattens that acidity toward a softer, rounder profile.
Volatile precursor formation — the compounds that become floral, fruity, and caramel aromatics after roasting — also depends on ripening duration. Rapid ripening from heat stress shortens the metabolic window, which is why cooler microclimates that slow ripening often yield greater accumulation of sugars and volatile precursors linked to specialty cup profiles.
A practical illustration: two lots from the same Ethiopian mountain, one from a north-facing valley with dense agroforestry canopy, the other from an open south-facing slope at the same elevation. The valley lot typically shows brighter acidity, more pronounced floral aromatics, and a longer finish. The slope lot is fuller-bodied with a shorter aromatic window. Same variety, same processing, same elevation band — different microclimate, different cup. Understanding how region shapes coffee flavor at this level of detail is what separates terroir-aware sourcing from generic origin labeling.
How microclimate conditions drive pest and disease pressure
Temperature and humidity do not just affect the plant. They set the reproductive rate of every organism sharing the farm, and several of coffee’s most damaging pests and pathogens are acutely sensitive to microclimate conditions.
Coffee berry borer (Hypothenemus hampei) thrives in warmer pockets. Its life cycle accelerates with temperature, meaning a block that runs 2–3°C warmer than the farm average can sustain significantly higher borer populations. Lower-elevation sections of a farm, or south-facing slopes with less shade, are the first places to show elevated borer counts.
Coffee leaf rust (Hemileia vastatrix) favors prolonged leaf wetness and moderate temperatures. Shade canopies that reduce temperature extremes can lower rust pressure, but a canopy that is too dense traps moisture and extends the leaf wetness period after rain, creating ideal conditions for spore germination. Shade tree canopy traits — specifically canopy openness and leaf area index — significantly predict local disease incidence, which means species selection matters as much as shade density.
Fungal foliar pathogens broadly follow the same pattern: they need moisture and limited airflow. Hollows and valley bottoms with poor air drainage are consistently higher-risk zones than ridges with natural ventilation.
Practical monitoring signs:
- Increased borer counts in warmer, lower-elevation blocks compared to cooler upper sections
- Rust lesions appearing first on plants in dense-canopy zones after prolonged humid periods
- Fungal spotting concentrated in topographic depressions with limited morning sun
The trade-off is real: shade reduces thermal extremes and can moderate rust pressure, but only when canopy architecture maintains enough airflow to prevent persistent leaf wetness. Agroforestry systems must be designed and pruned with both goals in mind.
Practical ways growers can shape microclimate on the farm
Growers have more control over their microclimate than most realize. The levers below range from low-cost and immediate to multi-year investments, and each carries trade-offs worth understanding before committing.
Pro Tip: When selecting shade trees, prioritize species with moderate canopy openness and a leaf area index that reduces daytime maxima without creating a closed, moisture-trapping canopy. A species like Grevillea robusta offers a relatively open crown that buffers temperature while maintaining airflow — a meaningful advantage over denser-canopied species in high-humidity environments.
| Management approach | Temperature buffer | Humidity effect | Cost / complexity | Time to effect |
|---|---|---|---|---|
| Moderate-shade agroforestry | Daytime max 4–5°C lower; night min 0.5–2°C higher | Raises humidity in dry periods; risk of excess moisture if canopy too closed | Medium / moderate | 3 years |
| Low-shade system | Modest daytime buffering (4–5°C reduction reported in shaded systems) | Limited humidity benefit | Low / simple | 1–3 years |
| Full-sun with drip irrigation | No thermal buffering | Controlled soil moisture only | High / complex | Immediate |
| Windbreaks | Reduces wind-driven transpiration stress | Slight local humidity increase | Low / simple | 2–5 years |
| Terracing / slope management | Reduces cold-air pooling in hollows; improves drainage | Moderate drainage improvement | High / complex | Immediate after construction |
Key implementation points:
- Shade-tree selection: Choose species based on canopy openness and leaf area index, not just growth rate. Canopy architecture predicts both microclimate outcome and disease risk.
- Targeted pruning: Prune shade trees before the main flowering flush to maximize light during that critical phase, then allow canopy to close for fruit development.
- Irrigation scheduling: Time irrigation to match peak water demand phases — flowering and grain ripening — rather than applying uniformly. This is especially important in microclimates with pronounced dry seasons.
- Windbreaks: Plant perpendicular to prevailing winds on exposed ridges; even a single row of taller trees reduces transpiration stress significantly.
- Frost protection: In hollows prone to cold-air pooling, avoid planting in the lowest 10–15 meters of a depression; use frost-tolerant rootstocks or cover crops that retain soil heat.
For monitoring, inexpensive data loggers placed at multiple points across a farm reveal the actual temperature and humidity variation between blocks. Leaf-wetness sensors in high-risk zones flag disease windows before symptoms appear. Remote-sensing tools and GIS-derived topographic layers can now map understory microclimate at roughly 30-meter resolution, making farm-level planning far more precise than it was a decade ago.
What recent research says about warming and shifting microclimates
The research picture is consistent: warming is narrowing the range of suitable microclimates for Arabica coffee, and the farms best positioned to adapt are those already managing microclimate actively.
NOAA observations show that higher temperatures accelerate fruit development in ways that harm bean quality and increase pest pressure. The direction of change is upslope — growers at lower elevations are already experiencing the compressed ripening windows and increased borer pressure that come with warmer conditions.
The yield sensitivity figure is striking: some studies estimate a roughly 14% yield reduction per 1°C rise in growing-season temperatures. That is not a distant projection. It describes the current exposure of farms already sitting at the warm edge of their suitable microclimate band.
A case study from southwestern Ethiopia, where Arabica coffee originated, used statistical downscaling to produce microclimate maps at 30-meter resolution. The findings showed that vegetation and topography together explain most of the microclimate variation across a landscape, and that coffee farming at lower elevations may need to relocate upslope under warming scenarios. Critically, vegetation can buffer macroclimate changes at mid-elevations, meaning agroforestry is not just a quality tool — it is a climate-resilience tool.
Seasonal shifts in relative humidity are an additional concern. Decreasing humidity at the start of the wet season disrupts flowering cues and fruit set timing, two phases with the highest water demand. Growers relying on historical rainfall calendars to time farm operations are increasingly working with outdated assumptions.
The practical implication: evaluate both elevation and in-farm buffering capacity together. A farm at 1,400 meters with well-managed agroforestry may remain viable longer than a farm at 1,600 meters with no canopy cover, because the buffering effect of vegetation against heat spikes often matters more than mean elevation alone. Altitude’s role in coffee flavor is real, but it operates through microclimate, not elevation per se.
How buyers and roasters should use microclimate information
Microclimate descriptors are not marketing decoration. They are the most predictive signals a buyer has for cup consistency and roast behavior, and the specialty trade is increasingly treating them that way.
When evaluating a lot, ask for these five data points:
- Elevation range of the specific block (not the farm average)
- Aspect (north/south/east/west facing) and topographic position (ridge, slope, valley)
- Shade system type (full sun, low shade, moderate agroforestry, dense canopy) and the dominant shade species
- Known nighttime lows during the ripening window, or at minimum the month of harvest relative to the regional dry season
- Inter-annual variability — does the producer note significant cup differences between years, which signals a microclimate sensitive to rainfall timing?
These descriptors predict roast behavior as well as cup profile. Coffees from cooler, high-diurnal-range microclimates tend to carry more intact sucrose and organic acid structure into the roast. They often benefit from a slightly extended first-crack development to highlight sugars without sacrificing the acidity that defines their character. Lots from warmer, compressed-ripening microclimates may need a lighter touch at development to avoid amplifying flatness.
Micro-lot sourcing built around microclimate data gives roasters a repeatable framework for predicting what a green coffee will do in the drum, rather than discovering it after the fact. That predictability is the practical payoff of treating terroir as a measurable variable rather than a story.
Key Takeaways
Microclimate is the single most controllable variable between a coffee plant and the cup it produces — growers who manage it actively and buyers who ask for it specifically will consistently outperform those who treat origin as a fixed given.
| Point | Details |
|---|---|
| Ripening speed is the core mechanism | Cooler microclimates slow ripening, allowing greater sugar and acid accumulation that drives specialty cup profiles. |
| Shade buffers temperature meaningfully | Shaded systems reduce daytime maxima by 4–5°C and raise nighttime minima by 0.5–2°C versus full sun. |
| Warming is already shifting suitable zones | Some studies estimate a roughly 14% yield reduction per 1°C rise in growing-season temperatures; farms at lower elevations face the most immediate pressure. |
| Canopy architecture controls disease risk | Shade tree species and canopy openness predict both microclimate outcomes and coffee leaf rust incidence. |
| Buyers should request five lot descriptors | Elevation range, aspect, shade type, nighttime lows, and inter-annual variability predict cup consistency and roast behavior. |
| Zscoffee sources with microclimate in mind | Zscoffee’s micro-lot and single-origin offerings reflect sourcing decisions informed by the farm-level conditions described here. |
The part of microclimate most buyers still overlook
Most sourcing conversations stop at elevation and country of origin. That is a start, but it leaves out the variables that actually explain why two lots from the same farm taste different in the same year. Aspect, topographic position, and shade architecture are the real levers, and they are rarely on a green coffee spec sheet.
The research on shade tree traits makes this concrete: canopy openness and leaf area index predict local disease incidence and temperature buffering better than shade density alone. Yet most buyers never ask which species are in the canopy, let alone what their leaf area index is. That gap is where quality gets lost between farm and roastery.
The other underappreciated point is the buffering argument for agroforestry under climate change. Elevation migration gets most of the attention in climate-and-coffee coverage, but a well-managed agroforestry system at a mid-elevation farm can buffer enough of the macroclimate shift to remain viable while a bare-slope farm at higher elevation cannot. The trees are doing work that no amount of altitude compensates for on its own.
For buyers, the practical move is to add three questions to every sourcing call: What is the shade system? What species dominate the canopy? How did the ripening window compare to the previous two years? Those answers tell you more about what is in the bag than the farm’s GPS coordinates.
Taste the difference microclimate makes
The science in this article points to one practical conclusion: the best way to understand microclimate’s impact on coffee is to taste it side by side. Zscoffee’s coffee and tea collection includes single-origin and micro-lot offerings sourced with farm-level conditions in mind, giving you a direct way to compare cups shaped by different growing environments.

Try brewing two micro-lots from contrasting origins back to back. Focus on acidity brightness, sweetness length, and aromatic complexity — the three sensory attributes most directly tied to ripening speed and microclimate conditions. Keep variables constant: same brew ratio, same water temperature, same grind setting. The differences you taste are the microclimate differences described throughout this article, now in your cup.
Browse the full catalog at Zscoffee to find lots with origin and sourcing notes, and use the descriptors from the buyer checklist above to guide your selection.
This article is general educational content. Sourcing and agronomic decisions should be confirmed with qualified professionals for your specific growing region and conditions.
Useful sources for further reading
- Climate.gov: Climate and Coffee — NOAA’s overview of how warming affects coffee cultivation, quality, and pest pressure; the most accessible entry point for the elevation-migration argument.
- Shaded-Coffee: A Nature-Based Strategy for Coffee Production Under Climate Change (Frontiers) — Peer-reviewed review covering measured temperature buffering ranges in shaded versus full-sun systems and ecosystem service trade-offs.
- The Understory Microclimate in Agroforestry Now and in the Future (Agriculture and Forest Meteorology) — Ethiopian case study demonstrating 30-meter microclimate mapping via remote sensing and projecting future suitability shifts.
- Impact of Climate on Water Status, Growth, Yield, and Phenology of Coffee Plants in Veracruz, Mexico (PLOS One) — Three-year field study quantifying how microclimatic variables, particularly minimum temperature and soil water storage, drive yield variability.
- Shade Tree Traits and Microclimate Modifications (Biotropica / Wiley) — Research showing that canopy openness and leaf area index predict both microclimate buffering and disease incidence, with direct implications for shade-tree selection.
- Green Coffee Collective Glossary: Microclimate — Practitioner-facing definition and examples of how specialty buyers use microclimate descriptors as predictive signals for cup consistency.