TL;DR:
- Sensory analysis uses human perception to measure coffee quality and guide roast development. Roaster panels monitor defects, optimize profiles, and align products with consumer preferences. Structured evaluation improves consistency, confidence, and ability to produce coffee that meets market demand.
Sensory analysis is the structured use of human perception — smell, taste, sight, mouthfeel — to measure, diagnose, and guide coffee quality decisions. For roasters, it is the feedback loop that connects what happens in the drum to what ends up in the cup. Without it, roast adjustments are guesswork, blending is intuition, and QC is reactive.
Here is what sensory analysis actually does for a roastery:
- Quality control: Trained panels catch defects before batches ship, reducing consumer complaints that are almost always sensory in origin.
- Roast optimization: Sensory endpoints tell you whether a development time change improved acidity clarity or introduced unwanted pyrazine heaviness.
- Blend and product development: Attribute gap analysis guides which coffees to combine and at what ratio.
- Consumer alignment: Methods like CATA and CVA link expert descriptors to what consumers actually prefer, not just what panelists detect.
Who uses it: roasters, QC teams, Q-graders, and product developers. Core methods include SCA cupping protocols, the Coffee Value Assessment (CVA), CATA (Check-All-That-Apply), and Coffee Cuality™. A basic program at a small U.S. roastery can start with two trained tasters, a standardized brew protocol, and a weekly cupping cadence.
Table of Contents
- What is the difference between sensory analysis and cupping?
- What sensory attributes do coffee professionals actually evaluate?
- How do you run a sensory evaluation on coffee?
- How does sensory analysis change what you do in the roaster?
- How do you connect expert panel results to what consumers actually want?
- How do you set up a sensory program at your roastery?
- What standards and training make sensory results credible?
- How should you record and report sensory results?
- Key Takeaways
- Why sensory rigor matters more than most roasters think
- Useful sources and further reading
What is the difference between sensory analysis and cupping?
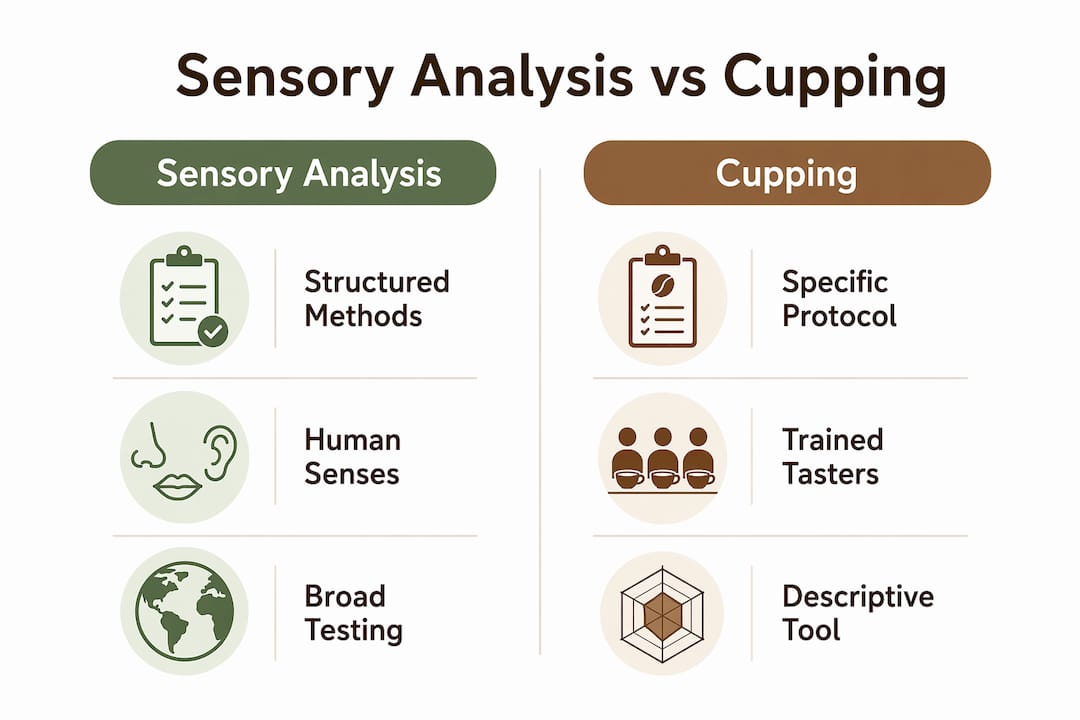
Sensory evaluation is the umbrella term for any structured method that uses human senses to assess a product. Sensory analysis sits within that umbrella and typically implies a more formal, reproducible framework with defined protocols, calibrated panels, and statistical outputs.

Cupping is one specific method inside that framework. It is both a descriptive tool (trained tasters profiling attributes) and an affective one (assessing overall quality or preference). The SCA cupping protocol standardizes brew ratio, grind, water temperature, and evaluation sequence so results can be compared across sessions and roasteries.
Beyond cupping, the field splits into two broad test types. Descriptive tests use trained panels and a shared lexicon to profile attributes objectively. Quantitative Descriptive Analysis (QDA) is the gold standard here. Affective or hedonic tests measure consumer liking, preference, or acceptance without requiring training. Just-About-Right (JAR) scales and CATA questionnaires fall into this category.
Knowing which type you need matters. Use descriptive tests for roast development and defect diagnosis. Use affective tests when you want to know whether a new product will sell. The Coffee Value Assessment (CVA) from the SCA and the Coffee Cuality™ method both combine elements of both, which is why they are gaining traction as production tools.
What sensory attributes do coffee professionals actually evaluate?
The primary attribute categories in professional coffee evaluation are fragrance and aroma, taste (sour, sweet, bitter, umami, salt), acidity, body and mouthfeel, aftertaste, balance, and defects. Each category carries both intensity and quality dimensions, and confusing the two is one of the most common errors in early-stage sensory programs.
Primary attributes and example descriptors:
- Fragrance/aroma: Floral (jasmine, rose), fruity (citrus, berry, stone fruit), nutty (almond, hazelnut), roasted (pyrazines: dark chocolate, tobacco), fermented (winey, funky), earthy, medicinal
- Taste: Sweetness intensity, sourness (acidity type), bitterness level, umami (savory, brothy)
- Acidity: Brightness, tartness, citric vs. malic vs. phosphoric character; both type and intensity matter
- Body/mouthfeel: Viscosity, creaminess, astringency, oiliness
- Aftertaste: Length, cleanliness, whether roasted or fruity notes linger
- Defects: Fermented off-notes, phenolic, rubbery, musty, baggy, grassy
The WCR Sensory Lexicon quantifies attributes on standardized intensity scales, which allows objective comparisons across samples rather than implying quality rankings. That is a critical distinction. A descriptor like “fermented” on the WCR lexicon is neutral; whether it is desirable depends on context and consumer segment.
The Coffee Taster’s Flavor Wheel organizes these descriptors visually, built from the WCR Sensory Lexicon through hierarchical clustering and multidimensional scaling with 72 experts. It works as a communication tool, not a scoring system. Use it to align language across your panel, not to rank coffees.
Intensity scales (1–15 or 0–10) are best for trained descriptive panels tracking attribute changes across roast trials. Qualitative descriptor lists work better for CATA-style consumer tests where you want to know which words a drinker would choose, not how intense each attribute is.
How do you run a sensory evaluation on coffee?
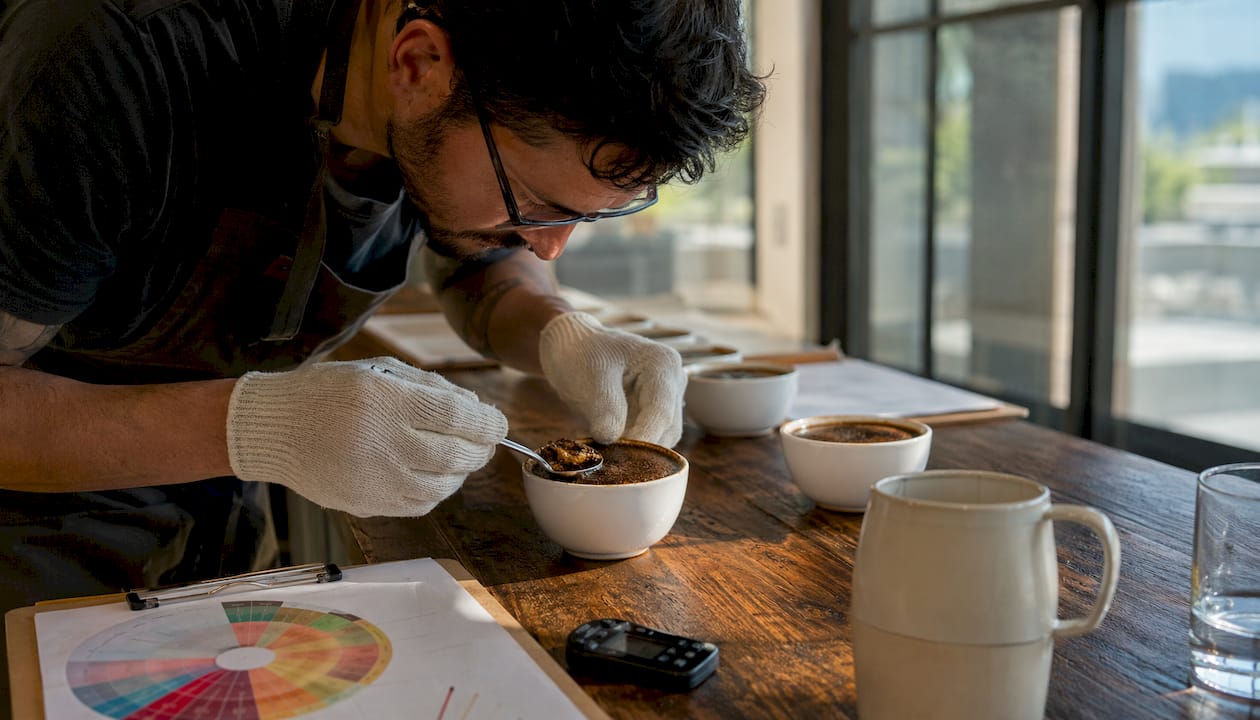
A standard cupping session follows a fixed sequence: evaluate dry fragrance, add hot water and assess wet aroma, break the crust and inhale, then liquor (taste) the sample as it cools through three temperature stages. The SCA cupping form scores fragrance/aroma, flavor, aftertaste, acidity, body, balance, uniformity, clean cup, sweetness, and overall, with a final total out of 100.
| Attribute | Score range | What it captures |
|---|---|---|
| Fragrance/Aroma | 6–10 | Dry and wet aromatic quality |
| Flavor | 6–10 | Taste and retronasal aroma combined |
| Aftertaste | 6–10 | Length and quality of finish |
| Acidity | 6–10 | Brightness and type |
| Body | 6–10 | Mouthfeel weight and texture |
| Balance | 6–10 | Harmony across attributes |
| Uniformity/Clean Cup/Sweetness | 0–10 each | Defect-sensitive categories |
| Overall | 6–10 | Holistic impression |
The 100-point total is useful for sorting and purchasing decisions, but it collapses a lot of information. Two coffees can score 87 for completely different reasons. That is why multi-dimensional reporting is gaining ground. The Coffee Cuality™ method, validated with 56 expert tasters, pairs a 100-point quality rating with JAR scales, CATA selections, and statistical analyses (penalty/lift, PCA, clustering) to explain why a coffee scored where it did. That deconstructed view is far more useful for roast development than a single number.
Panel types differ by purpose. Trained expert panels (QDA, CVA, Coffee Cuality™) produce reproducible descriptive data. Consumer or hedonic panels reveal preference and liking. CATA is a strong alternative to QDA for identifying sensory drivers of liking when budget or timeline limits trained panel work, though high-accuracy profiling still requires trained tasters.
For data capture, software like FIZZ (Biosystèmes) or EyeQuestion (Logic8) standardizes form entry and enables statistical output. When you need to go deeper than panels can reach, GC–MS volatile profiling augments sensory data with chemical precision.
Pro Tip: Run every cupping session blind. Code samples with three-digit numbers and randomize presentation order. Taster expectation bias is real and measurable, and it skews scores more than most roasters expect.
How does sensory analysis change what you do in the roaster?
Sensory data gives roast decisions a target. Without it, you are adjusting curves based on color, crack timing, and weight loss — all useful, but none of them tell you whether the cup is actually better.
Specific use-cases where sensory endpoints drive roast changes:
- Diagnosing overdevelopment: Flat, papery, or tobacco-heavy aftertaste signals excessive Maillard product accumulation. Shorten development time and re-cup.
- Identifying vegetal or grassy notes: Underdevelopment. Chlorogenic acids and certain aldehydes haven’t degraded. Extend development or raise charge temperature.
- Tuning for acidity type: Citric acidity peaks at lighter roasts; malic and phosphoric notes shift with degree of roast. Sensory profiling at multiple roast levels maps where your target acidity lives.
- Controlling roasted/nutty notes: Pyrazines and furans are roast-sensitive volatile markers. Roasting conditions often modulate these volatile classes more strongly than origin, so roast profile choices can significantly shift the final aroma profile.
For roast trials, isolate one variable at a time: development time, end temperature, or charge temperature. Run three to five roast levels, cup them blind against your target profile, and record CATA selections for each. The pattern of descriptor shifts tells you exactly where on the curve your target sits. Flavor mapping across roast levels makes this visual and easy to communicate to your team.
Blending decisions follow the same logic. If a single-origin coffee scores high on acidity but low on body, a sensory map identifies which second coffee fills the body gap without muddying the acidity. Document the blend ratio and the sensory rationale together so future batches can be reproduced.
For production QC, cup every roast lot against a reference standard. Set acceptance criteria (e.g., minimum score thresholds, zero tolerance for fermented or phenolic defects) and define the corrective action trigger. A complete guide to coffee defects helps tasters recognize and name what they are detecting before it costs you a batch.
Pro Tip: Keep a sensory log tied to your roast log. Date, batch number, roast curve parameters, and cupping scores in one place. After six months, patterns emerge that no single session reveals.
How do you connect expert panel results to what consumers actually want?
Expert detection does not equal consumer liking. A trained panel can identify every volatile compound driving a fermented note; whether consumers find that note appealing depends on their segment, their cultural context, and how intense it is. Bridging that gap is where consumer testing earns its place.
Trained panels detect quality problems early, and most consumer complaints trace back to sensory failures. That makes sensory QC a direct line to customer retention, not just a technical exercise.
CATA questionnaires are the most practical consumer test for a roastery. Present a brewed sample, give consumers a list of 15–25 descriptors, and ask them to check all that apply. Combine that with a hedonic rating (overall liking, 1–9 scale) and you get a map of which descriptors drive liking and which drive rejection. Penalty/lift analysis on JAR data then shows which attributes are “too much” or “too little” for your target consumer. This is the core logic of the SCA CVA standard, which encourages CATA plus intensity scoring rather than single-dimension ratings.
On the analytical side, explainable AI models trained on GC–MS volatile profiles can classify coffee origin at 91% accuracy and predict panel-assigned aroma intensity with R² = 0.88 (n = 32 single-origin samples). That means chemical fingerprinting can now predict sensory outcomes before a panel convenes, which is useful for green buying decisions and consistency checks. How flavor shapes beverage choice at the consumer level follows similar logic: sensory signals drive purchase decisions in ways that marketing copy alone cannot replicate.
A practical example: if CATA data shows that “roasted” and “dark chocolate” descriptors are the strongest drivers of liking for your espresso blend consumers, and a new single-origin candidate scores low on those attributes, you have a data-backed reason to either blend it differently or position it for a different audience.
How do you set up a sensory program at your roastery?
A working program does not require a laboratory. It requires consistency, a defined protocol, and honest calibration.
- Define your objective. QC (catching defects before shipping) and product development (optimizing roast profiles) need different panel types and frequencies. Start with QC if you have no existing program.
- Choose your panel type. An internal trained panel of two to four tasters is the minimum for reliable descriptive work. For consumer preference data, recruit 30–50 untrained participants per test.
- Set a brew standard. Follow SCA sample preparation procedures: 8.25 g per 150 mL, water at 200°F (93°C), five-minute steep, no agitation before breaking the crust. Consistency here is non-negotiable.
- Acquire minimal equipment. Cupping bowls (6 oz, standardized), a calibrated scale, a consistent grinder, a timer, and spittoons. Add a water quality meter if your tap water varies.
- Train and calibrate tasters. Use the WCR Sensory Lexicon references for attribute anchoring. Run calibration sessions monthly: present known reference samples and compare taster scores. Acceptable inter-taster agreement is the goal, not identical scores.
- Schedule a cupping cadence. Weekly for production QC; per-roast-trial for development work. Cup every new green lot before committing to a roast profile.
- Build your SOP. Include: blind sample coding, randomized presentation order, palate-cleansing protocol (water, plain crackers), recording method (paper form or digital), and corrective action thresholds.
Timeline and cost expectations: In the first 30 days, establish your protocol and run calibration sessions. By 90 days, you will have enough comparative data to set meaningful acceptance thresholds. By 180 days, trend analysis across lots becomes possible. Cost drivers include taster training (CQI Q-grader courses run several hundred dollars per candidate), cupping supplies (modest), and software if you move beyond paper forms. A small roastery can run a credible program for well under $1,000 in the first year if training is done in-house using SCA resources.
What standards and training make sensory results credible?
Reproducibility is what separates sensory data from opinion. Three bodies set the standards that make results defensible.
- SCA (Specialty Coffee Association): The CVA standard defines descriptive and affective assessment methods and is the current industry benchmark for specialty coffee evaluation. The SCA cupping form and protocols are the most widely used reference in the U.S. market.
- Coffee Quality Institute (CQI): The Q-grader certification program trains and tests tasters against SCA standards. Q-graders are the most recognized credentialed tasters in the U.S. specialty coffee industry. CQI also offers Q-processing and green grading certifications.
- World Coffee Research (WCR): The WCR Sensory Lexicon is a descriptive, non-judgmental tool for reproducible scientific profiling. It differs from commercial flavor wheels in that it quantifies attributes on standardized intensity scales rather than implying quality rankings.
- Coffee Cuality™: A validated multi-dimensional expert assessment method that combines a 100-point rating with JAR, CATA, and statistical analysis. Validated with 56 expert tasters, it provides a defensible quality rating with a statistical framework to explain it.
Calibration frequency matters as much as initial training. Run internal calibration monthly using reference samples with known profiles. When results drift beyond acceptable variance, retrain before the next production session. For high-stakes decisions (green buying, new product launch), bring in an external certified grader to validate your panel’s outputs.
The specialty coffee quality standards that define the category are built on this sensory infrastructure. Without standardized lexicons and calibrated panels, “specialty” is a marketing claim rather than a measurable outcome.
How should you record and report sensory results?
A sensory result that cannot be reproduced or explained is not useful data. Every session should generate a record that a different taster, on a different day, could use to replicate the evaluation.
Minimum fields to record for every sample:
| Field | What to capture |
|---|---|
| Sample ID | Blind code plus lot/batch reference |
| Roast profile | Charge temp, development time, end temp, roast date |
| Brew parameters | Dose, grind setting, water temp, steep time |
| Panel composition | Number of tasters, training level, calibration date |
| Cupping scores | Per-attribute scores and total |
| CATA selections | All checked descriptors per taster |
| JAR ratings | Per-attribute just-about-right ratings where used |
| Open comments | Defect notes, unusual observations |
| Corrective action | Decision taken if thresholds were not met |
Reporting best practices: include sample codes (never names during evaluation), replicate counts, means and standard deviations per attribute, and penalty/lift analysis summaries for JAR and CATA data. State panel size and training level explicitly so readers of the report can weight the results appropriately.
For multivariate analysis (PCA, clustering), a minimum of 8–10 samples per session and at least 6 trained tasters produces statistically interpretable output. Below that threshold, report descriptive statistics only and note the limitation. A scoring guide helps contextualize what score ranges mean across different grading systems when you need to compare results across buyers or certifications.
Key Takeaways
A structured sensory program, built on calibrated panels, standardized lexicons, and multi-dimensional reporting, is the most direct tool a roastery has for controlling quality and developing products that consumers actually buy.
| Point | Details |
|---|---|
| Start with a cupping protocol | Adopt SCA sample prep standards from day one to make results comparable across sessions. |
| Pair expert and consumer tests | Expert panels catch defects; consumer CATA/JAR tests confirm whether your profile matches market preference. |
| Use the WCR lexicon for calibration | Standardized descriptors reduce inter-taster variability and make your sensory data reproducible. |
| Tie sensory data to roast logs | Linking cupping scores to roast curve parameters reveals patterns that single sessions cannot show. |
| Move beyond the single score | Multi-dimensional methods like CVA and Coffee Cuality™ explain why a coffee scored where it did. |
Why sensory rigor matters more than most roasters think
Here is the uncomfortable truth about sensory work in specialty coffee: most roasters cup regularly, but very few run a program that actually generates actionable data. The difference is not equipment or budget. It is discipline around blind coding, calibration, and recording.
The shift from SCA-style scoring to CVA or Coffee Cuality™-style approaches is harder than it looks. Deconstructing overall quality into JAR and CATA measures requires tasters to think differently about what they are evaluating. The learning curve is real. But the payoff is that you stop arguing about whether a coffee is “good” and start understanding which attributes are driving that judgment and for which consumers.
The other thing most articles on this topic understate: roast profile choices often matter more than origin for the final aroma profile. Pyrazines and furans respond to roast variables more strongly than to terroir. That means sensory analysis is not just a QC tool. It is a roast design tool. When you cup your way through a development time trial and track how roasted and nutty descriptors shift, you are doing applied volatile chemistry without a GC–MS machine.
At Zscoffee, sensory evaluation informs every sourcing decision and every product description. When a coffee is listed with “bright citrus acidity and a clean finish,” that language comes from cupping notes, not marketing copy. Readers who want to taste the range can explore the coffee and tea collection and experience how sensory-driven sourcing translates to the cup. The full catalog at Zscoffee reflects coffees selected with exactly this kind of structured evaluation behind them.
Useful sources and further reading
Where to start depends on your goal:
- For QC and defect detection: The Role of Sensory Evaluation in Food Quality Control: A Case of Coffee Study is the most practical academic reference for linking panel work to production outcomes.
- For modern multi-dimensional assessment: Validation of the Coffee Cuality™ Method explains the JAR/CATA/statistical framework in detail and is worth reading before you invest in panel training.
- For standardized language: The WCR Sensory Lexicon and the Coffee Taster’s Flavor Wheel study are the two documents every panel trainer should have on hand.
- For consumer testing methods: Drivers of coffee liking covers CATA and JAR methodology in a coffee-specific context.
- For roast chemistry: The volatile compounds and roasting study explains pyrazine and furan behavior across roast levels.
- For SCA standards: The CVA standard page is the primary reference for current industry assessment norms.
- For analytical augmentation: Explainable AI for Coffee Quality Control covers GC–MS plus machine learning for origin classification and aroma intensity prediction.
- For practical cupping technique: The Zscoffee cupping guide and tasting guide translate protocol into practice.